Is Render (RENDER) Gearing Up For Breakout Rally? This Fractal Says Yes!

Date: Mon, April 14, 2025 | 06:10 AM GMT
The cryptocurrency market has endured a brutal start to the year, with Ethereum (ETH) logging a staggering 45% drop in Q1 — its worst quarterly performance in years. This widespread downturn rippled across the entire altcoin sectors. However, investor sentiment is beginning to shift following U.S. President Trump’s last weeks announcement of a 90-day tariff pause, a move that injected fresh optimism into the market.
One token that appears to be taking advantage of this shift is Render (RENDER). After suffering a steep decline this year, the AI-focused token has rebounded sharply, registering impressive 43% gains over the past week.
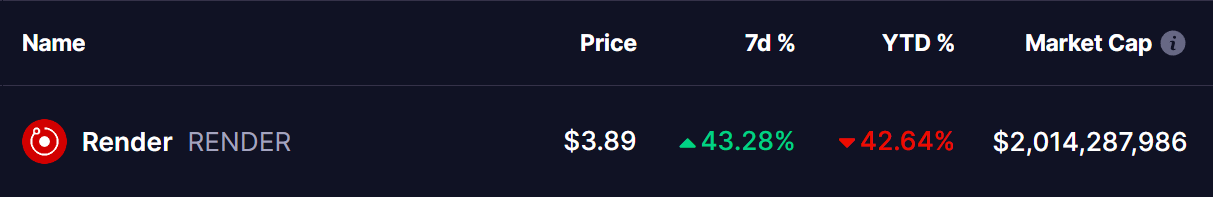 Source: Coinmarketcap
But beyond the bounce, what’s really catching the attention of traders is a striking similarity between RENDER’s current price structure and Cosmos (ATOM)’s breakout setup from late 2023 to early 2024.
RENDER Chart Resembles ATOM’s Past Price Behavior
When analyzing the daily chart, it becomes evident that RENDER is following a path uncannily similar to ATOM’s previous price action. Back in 2023, ATOM spent several months forming a large falling wedge pattern, where the highs and lows consistently trended downward into a tightening range — a classic bullish setup.
ATOM eventually broke out of that wedge — and crossed above its 100-day moving average — triggering a powerful 91% rally from around $7.60 to over $14.50 between November 2023 and March 2024.
Now, on the right side of the comparative chart, RENDER is showing almost identical behavior. It has just broken out from a falling wedge of its own and is currently attempting to break above a “W” double bottom pattern, nearly mirroring ATOM’s structure at the beginning of its breakout phase. This “W” pattern, combined with an effort to reclaim the 100-day moving average, is viewed as a key trigger level by many technical analysts.
If RENDER successfully flips this resistance into support — just like ATOM did — it could confirm the start of a bullish trend reversal. Based on the fractal comparison, a rally toward the $8–$10 range in the coming months is entirely plausible.
Adding to the bullish case, the MACD (Moving Average Convergence Divergence) — a popular momentum indicator — is also flipping bullish.
Is a Breakout Rally on the Horizon?
While the crypto market remains unpredictable, the fractal similarity between RENDER and ATOM is hard to ignore. RENDER appears to be retracing ATOM’s footsteps step by step — from wedge formation, to breakout, to MACD crossover, and now testing a potential breakout level above key moving averages.
If market conditions remain stable and Render maintains momentum, the token could be on the verge of an explosive upside — much like the one ATOM delivered just months ago.
Disclaimer: This article is for informational purposes only and not financial advice. Always conduct your own research before investing in cryptocurrencies.
Disclaimer: The content of this article solely reflects the author's opinion and does not represent the platform in any capacity. This article is not intended to serve as a reference for making investment decisions.
You may also like
NYC Announces First Crypto Summit to Court Titans Holding $1T in Assets
Shaquille O’Neal settles FTX lawsuit with undisclosed terms

Revolut profits hit $1.3 billion on crypto and user growth

Discover How Sui Blockchain Captivates the Crypto World with Remarkable Growth
In Brief Sui Blockchain experiences impressive growth, reaching $2.92 per token. Grayscale's involvement fuels institutional interest and trading volume. Technological innovations boost Sui's appeal among developers and investors.