XRP Bounces from Key Support – But Familiar Fractal Raises Bearish Concerns

Date: Tue, April 08, 2025 | 06:10 AM GMT
After a brutal “Black Monday” in the markets triggered by President Donald Trump’s aggressive new tariff policies, global financial assets—including crypto—faced a sharp decline. However, Tuesday has brought some relief, with both Bitcoin (BTC) and Ethereum (ETH) bouncing back into green territory, posting gains of 3% and 2% respectively.
Among altcoins, XRP also showed signs of recovery, jumping over 7% to trade near $1.87. But while this bounce looks promising on the surface, a deeper dive into historical patterns suggests caution might be warranted.
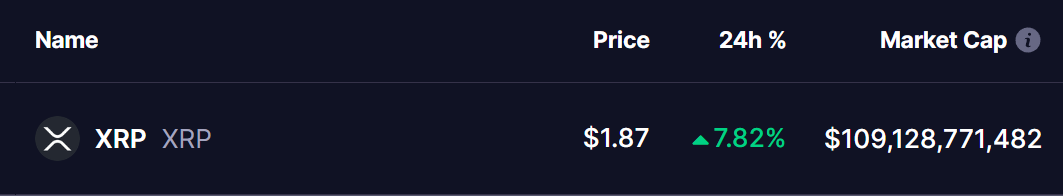 Source: Coinmarketcap
A Bearish Fractal from the Past: DOT vs. XRP
Looking at the current chart of XRP, there’s an eerie resemblance to Polkadot’s (DOT) price action from early 2022. Just like DOT back then, XRP recently formed a head and shoulders pattern—a classic bearish setup.
XRP broke down from this pattern after failing to hold its critical neckline support at $1.90, sliding down to test a strong support near $1.61. From there, the price bounced back and is now hovering just below its old neckline, trading near at $1.87.
This is nearly identical to DOT’s price action in Q1 2022. DOT also lost its neckline, bounced temporarily, retested the breakdown zone—and then resumed a steep decline that saw its price spiral down more than 70% in the following months.
Can XRP Avoid DOT’s Fate?
Unless XRP can reclaim and hold above $1.90, the current bounce may just be a short-term relief rally. Adding to concerns is the fact that XRP is now below its 50-day moving average, while only the 200-day MA at $1.84 is offering nearby support.
If XRP follows the same trajectory as DOT did in 2022, the next downside targets could lie between $1.45 to $1.30, as marked by previous demand zones.
Final Thoughts
While the broader crypto market is attempting to stabilize, XRP’s fractal resemblance to DOT’s 2022 breakdown should not be ignored. Traders and investors might want to wait for a clean breakout above the neckline at $1.90 before turning bullish again.
Disclaimer: This article is for informational purposes only and does not constitute financial advice. Always do your own research before making investment decisions.
Disclaimer: The content of this article solely reflects the author's opinion and does not represent the platform in any capacity. This article is not intended to serve as a reference for making investment decisions.
You may also like
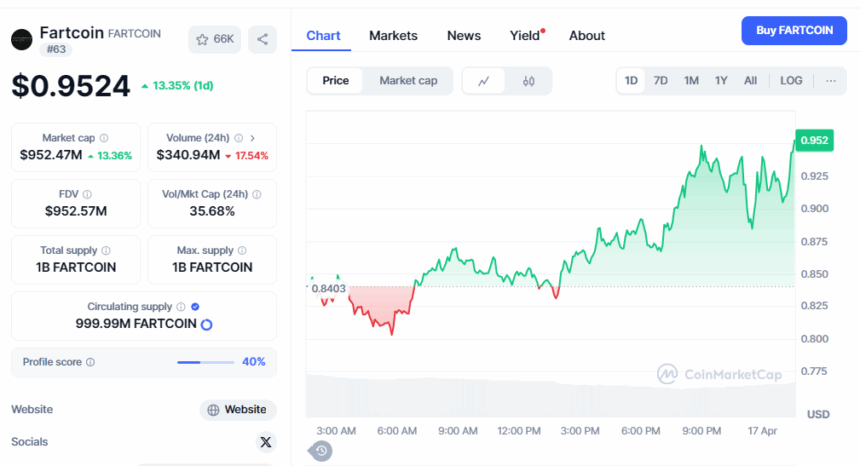
Fartcoin Pumps More 12% As Whales Keep Buying; Can it Break $1 by Sunday?
Bitcoin Sets Higher Lows—Can Bulls Target $88K Resistance?

Bitcoin Slips Below Trendline—Can $82.8K Hold the Line?

Bitcoin’s Bull Score Index Hits 58 Days Below 50: What’s Next?