
Last updated: February 11, 2025 13:44 EST
Pepe Coin Crashes 65% but Traders Predict a Shocking 110% Rebound
By:Alejandro Arrieche
Pepe (PEPE) shows signs of an upcoming trend reversal that could produce gains of over 100%
Disclaimer: Crypto is a high-risk asset class. This article is provided for informational purposes and does not constitute investment advice. You could lose all of your capital.

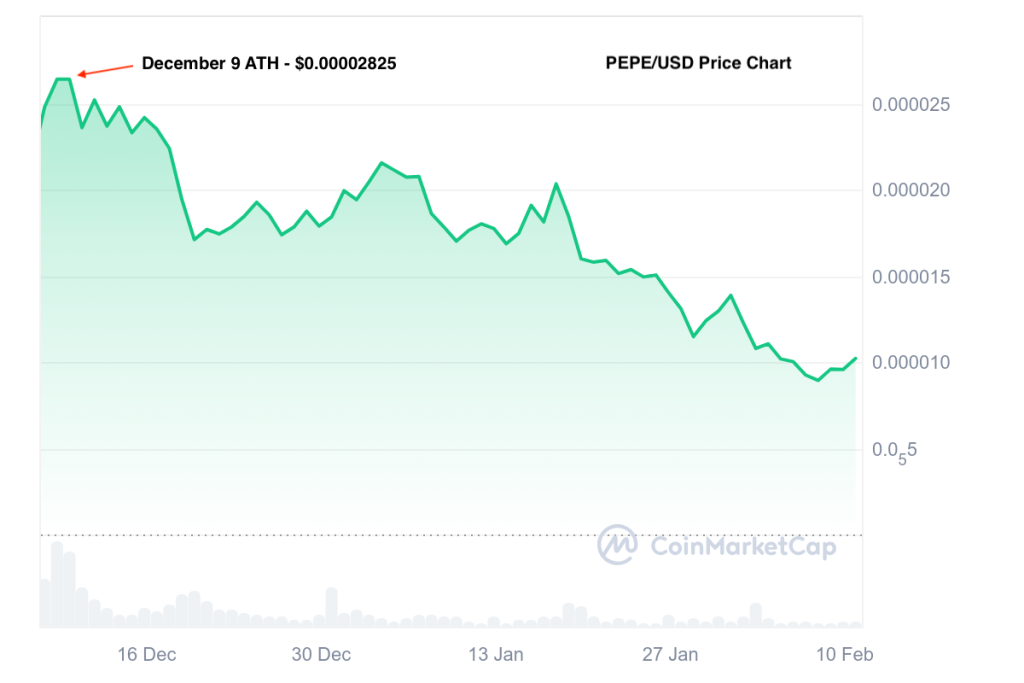
The price of Pepe (PEPE) has been in a sharp downtrend since the end of last year, with the post-election rally steadily losing momentum. It now trades 65% below its December 9 all-time high.
Intense sell-side pressure recently pushed PEPE to its lowest level since November 7. However, early signs of a potential recovery are emerging on the charts.
If this rebound gains traction, PEPE could see gains of up to 110% in the coming weeks.
Since the start of the year, Pepe (PEPE) has lost 50.3% of its value, making it the worst-performing asset among the top five meme coins. Others, like Floki (FLOKI) and dogwifhat (WIF), have also seen steep declines of 46.4% and 64.2%, respectively.
The total market cap of meme coins has dropped from a peak of $150 billion to under $70 billion, according to CoinMarketCap. This decline has been driven by the Federal Reserve’s decision to scale back expected interest rate cuts, dampening investor sentiment.
Adding to the uncertainty, Donald Trump’s aggressive trade policies toward Mexico and Canada have sparked fears of a trade war, leading to a broader risk-off move that has weighed heavily on the crypto market.
Pepe (PEPE) Chart Shows Clear Buy Signal as Momentum Turns Positive
Pepe’s daily chart reveals that its recent downtrend has formed a bullish falling wedge pattern. This setup often precedes a sharp breakout, with the potential for gains matching the triangle’s base.
For PEPE, this suggests an upside potential of around 110% from the wedge’s lower boundary, or approximately 100% based on today’s price.
If momentum shifts in favor of the bulls, a breakout could lead to a strong recovery in the coming weeks.
Although a breakout has yet to occur, momentum indicators suggest a bullish move for PEPE, with the Relative Strength Index (RSI) crossing above the signal line and stepping out of oversold territory.
Meanwhile, the MACD histogram has posted its first positive reading in weeks, reinforcing the potential for a shift in trend.
This RSI setup presents an attractive risk-to-reward opportunity for traders, especially with a bullish pattern forming and confirmation from key indicators.
0
0
Disclaimer: The content of this article solely reflects the author's opinion and does not represent the platform in any capacity. This article is not intended to serve as a reference for making investment decisions.
PoolX: Locked for new tokens.
APR up to 10%. Always on, always get airdrop.
Lock now!
You may also like
Meme and AI token indices plummet 50% from December peaks while US and DeFi indices show resilience
The GMMEME and GMAI indices, for example, are down nearly 60% from their peaks in December.The following is an excerpt from The Block’s Data and Insights newsletter.
The Block•2025/02/12 00:33

Could Litecoin Be the Next Big Runner? $1.5 Billion Volume Pushes LTC Up 12%
Litecoin ($LTC) has been propelled to the forefront of the altcoin market with rumours of an ETF approval.
CryptoNews•2025/02/11 23:55

Why Is Stellar Dropping? XLM Turns Red as Market Shifts – What’s Next?
Stellar has been trading within a bullish flag pattern since the end of January, suggesting that it could stage a breakout very soon.
CryptoNews•2025/02/11 23:55

RWA tokens went against the trend, becoming the top narrative for the past month
Share link:In this post: The RWA tokenization narrative outperforms other sectors, growing by over 31% based on Artemis data. Ondo and Mantra led the growth of RWA tokens, with the addition of newly created projects. Token issuers have brought $17.18B in real-world assets, though liquidity is fragmented and there is no common standard of tokenization and settlement.
Cryptopolitan•2025/02/11 23:00

Trending news
MoreCrypto prices
MoreBitcoin
BTC
$95,347.98
-2.38%
Ethereum
ETH
$2,588.57
-3.54%
Tether USDt
USDT
$0.9997
-0.05%
XRP
XRP
$2.39
-2.13%
Solana
SOL
$194.54
-3.59%
BNB
BNB
$631.54
+1.47%
USDC
USDC
$0.9999
-0.01%
Dogecoin
DOGE
$0.2512
-2.73%
Cardano
ADA
$0.7624
+1.28%
TRON
TRX
$0.2387
-3.69%
Bitget pre-market
Buy or sell coins before they are listed, including PLUME, J, and more.
Trade now
Become a trader now?A welcome pack worth 6200 USDT for new Bitgetters!
Sign up now