BTC bull market last leg: RHODL indicator breakthrough triggers price surge, $145,000 in sight
CryptoChan2024/12/02 09:17
By:CryptoChan
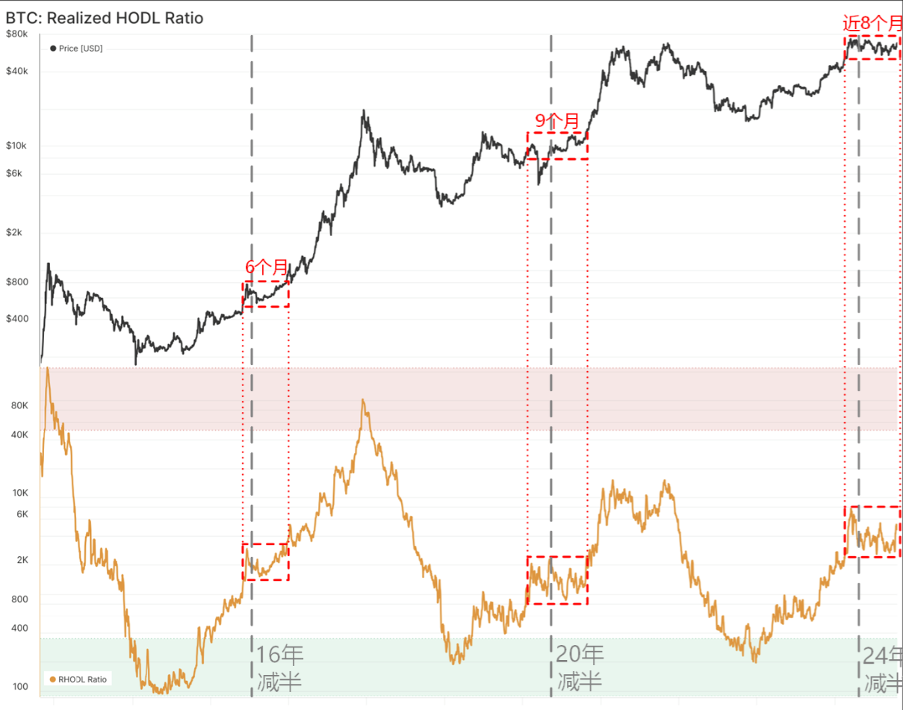
First, let's review the BTC: RHODL indicator that we emphasized in the previous monthly report (October 18, 2024). This indicator is the ratio of "the number of BTC held on the chain for one week" to "the number of BTC held on the chain for 1-2 years", used to reflect the performance of short-term chips relative to long-term chips
In history, before and after the halving, the RHODL indicator will experience long-term fluctuations, and the currency price will also adjust horizontally during the same period. The previous monthly report mentioned that the indicator and the currency price have been fluctuating horizontally for nearly 8 months, and it has reached the point where it may break through at any time. The latest situation of this indicator is shown in the following figure
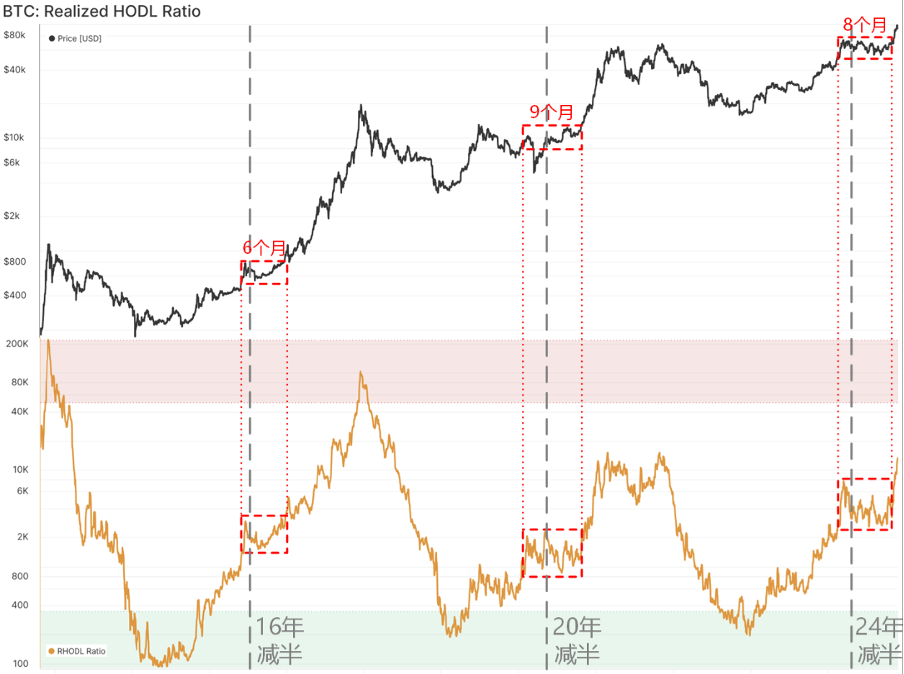
It can be seen that shortly after the last monthly report, the RHODL indicator broke through smoothly, and the coin price also rose strongly to a high of nearly 100,000 US dollars. Next, we will look forward to the last journey of the bull market in terms of time and space
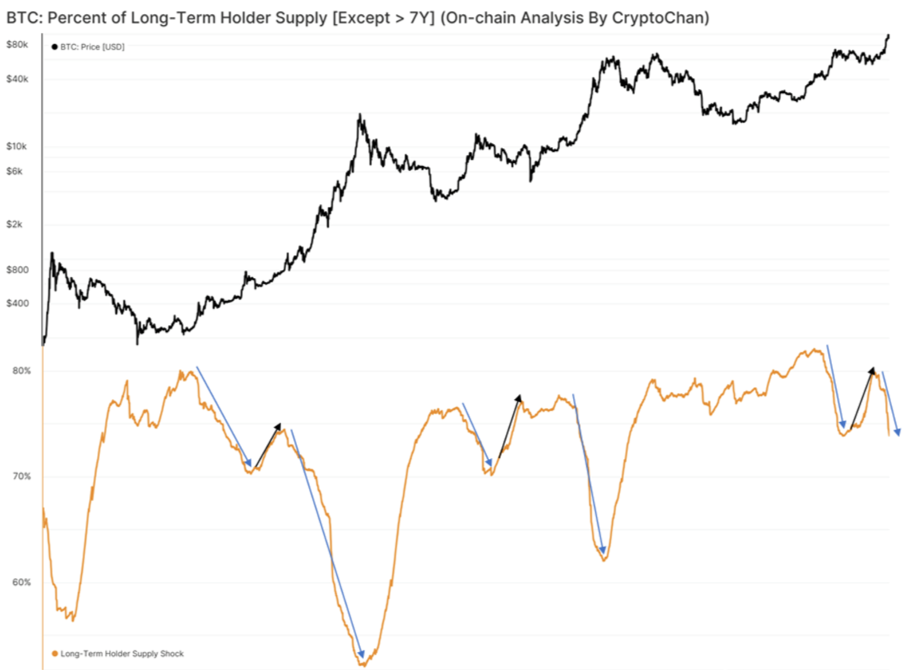
First, let's look at the time dimension. The above chart is also one of the core on-chain data. The upper indicator in the chart is the BTC price, and the lower indicator is the percentage of BTC held by long-term holders on the chain to the total circulation of BTC. Historically, during bull market cycles (15-17 and 19-21), this indicator has experienced two major cycles of decline, with a rebound in the transition period between the two declines
In principle, it is also easy to understand: in the early stage of the bull market after the end of the bear market, long-term holders took advantage of the rebound in coin prices to sell chips on a large scale, causing the first wave of decline in the indicator; then, as the coin price entered a long horizontal adjustment in the middle of the bull market, long-term holders hibernated and more and more coins became long-term chips as time passed, causing the indicator to rebound; after the coin price experienced a long adjustment, it continued to charge to new highs, and the market entered the second half of the bull market. Long-term holders also continued to sell profits as the coin price continued to rise, causing the second wave of large-scale decline in the indicator
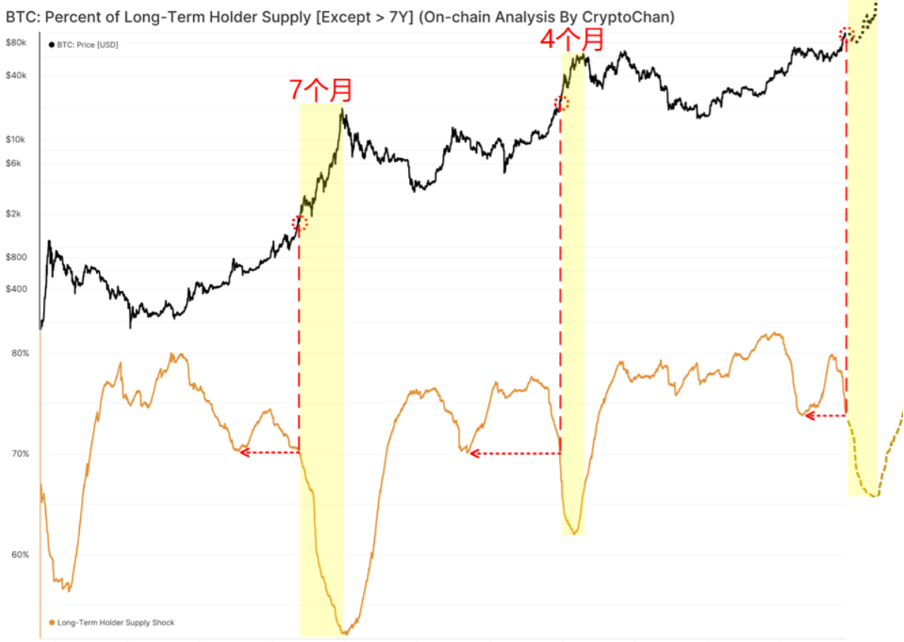
Currently, this indicator has already entered the second wave of large-scale decline, and if it falls to the position engraved in 2016-2017 and 2020-2021, then the next bull market progress may still have 4-7 months left
Then look forward to the spatial dimension of the last leg of the bull market
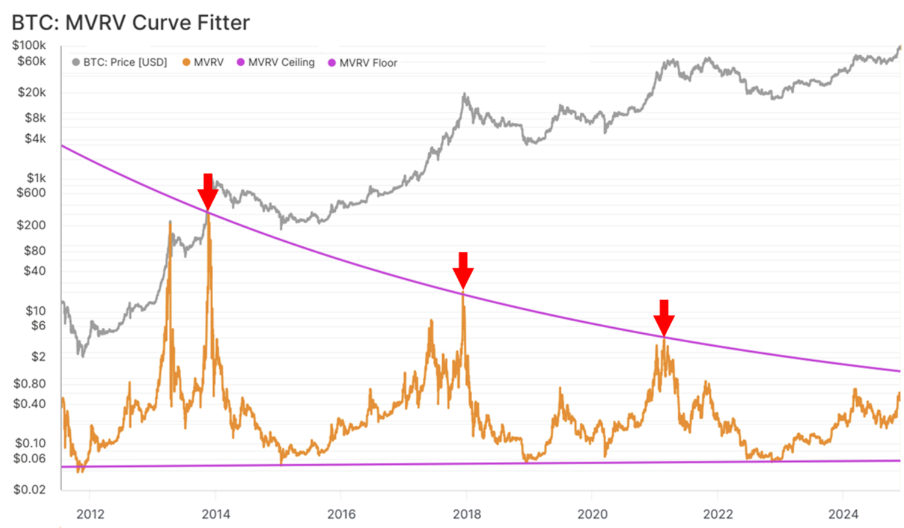
The indicator in the figure is BTC: MVRV, which is the " (current market price)/(buy price) " of all BTC on the chain, reflecting the average rate of return of all investors
Then, using the y = a + b * e ^ (c * x) function to fit the historical top of the MVRV indicator (red arrow in the figure), it is speculated that the MVRV of this bull market may reach a height of 3.5 based on the fitting function
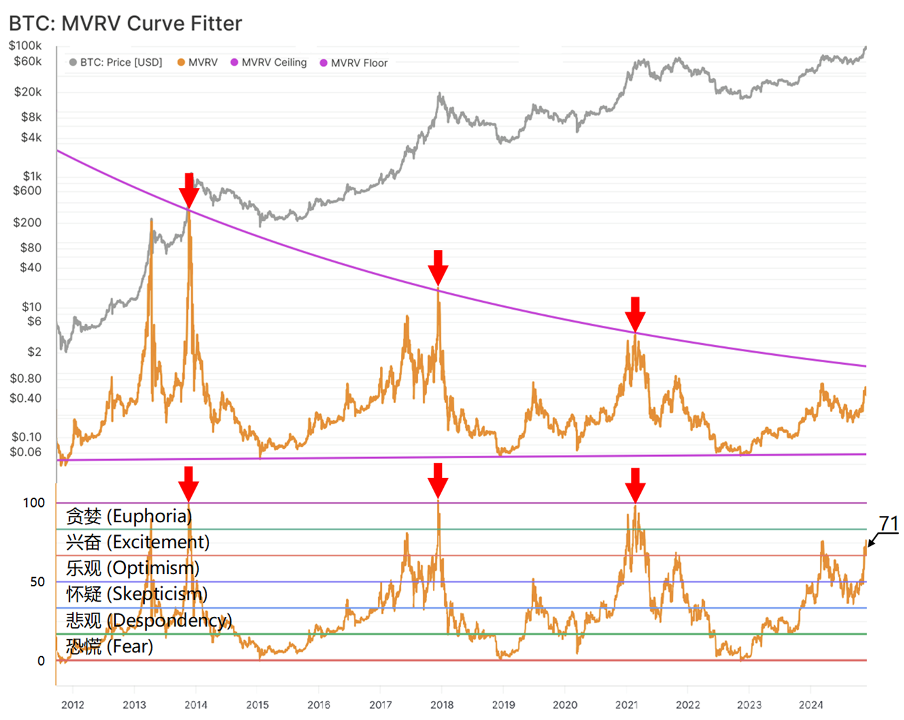
Finally, according to the upper limit fitting function and the lower limit fitting function, the oscillation indicator of 0-100 is added to completely divide the coin price from the bottom to the top into six stages. The current score of this indicator is 71, which is in the exciting range (only looking at today's data, the indicator reaches 100, and the coin price is at least 133,000).
Finally, we would like to mention that most of the above analysis is based on larger cycles, and to complete the bull market top escape requires stricter tactical execution
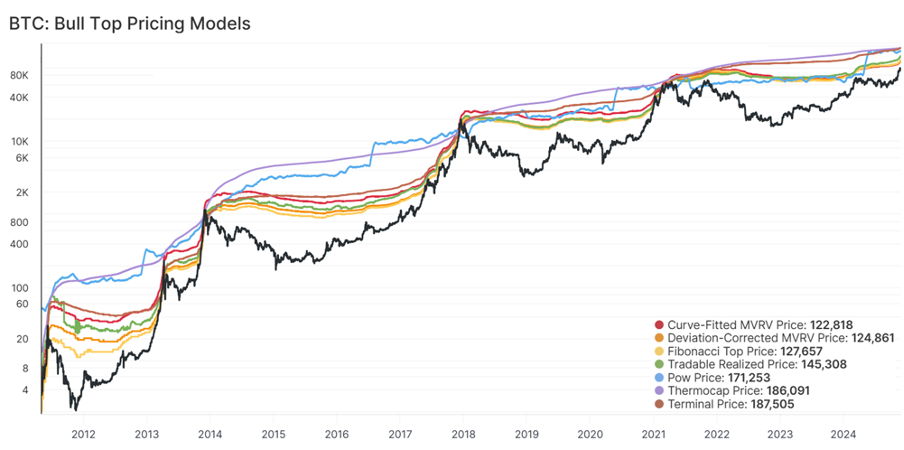
With this purpose in mind, we have spent a lot of effort developing various top pricing indicators, and finally selected seven top pricing indicators (as shown in the figure above) after multiple rounds of iteration and improvement. Considering the maintenance indicator Alpha, the specific formula is not yet public, please understand
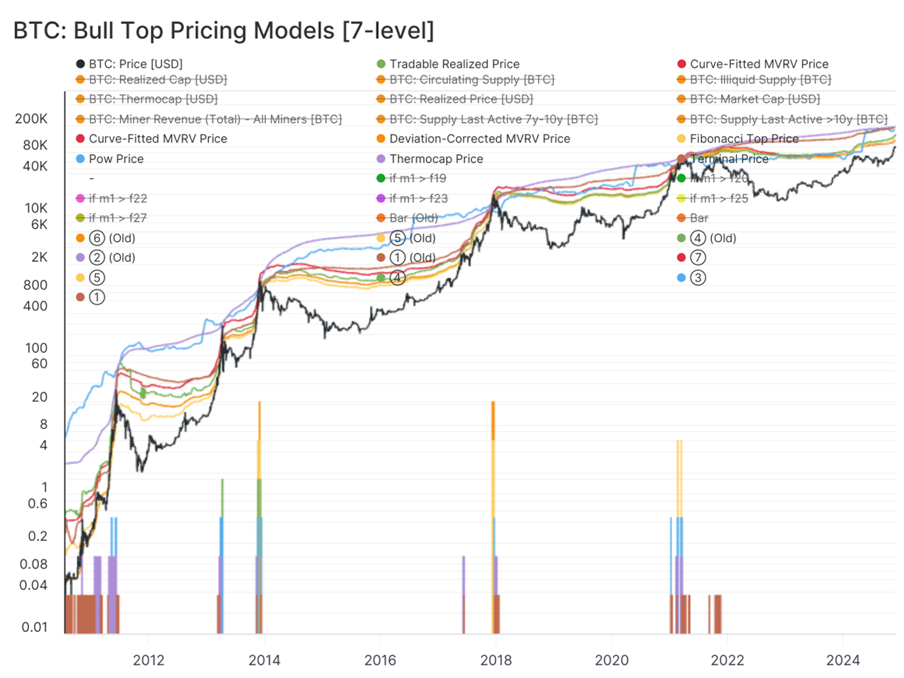
In addition, a bar chart is added to show the number of pricing indicators for the currency price breaking through the bull top. It can be seen intuitively that in history, Bitcoin has always broken through 5 or even 6 lines in a short period of time before completing the peak
The tactical inspiration this brings us can be in the future bull market peak process, referring to the bar chart, as the coin price continues to break through the bull top pricing indicator, it can continue to escape the top in batches, the more breakthroughs, the more positioning clearance
It is worth mentioning that the price of the bull top in 2013 and 2017 broke through 6 lines, and the price of the bull top in 2021 broke through 5 lines. If it is conservatively estimated that this round of bull top will only break through 4 lines, and the current price of the 4th line is 145,000 dollars, then this round of bull top may break through at least 145,000 dollars
Summary
The long mid-term bull market swing will end and usher in a new chapter, just like previous cycles
The final leg of the bull market is roughly predictable in terms of time and space (except for the Black Swan event).
Escaping to the top of the bull market is a small probability, while completing the bull market and obtaining substantial profits is a high probability (not FOMO).
0
0
Disclaimer: The content of this article solely reflects the author's opinion and does not represent the platform in any capacity. This article is not intended to serve as a reference for making investment decisions.
PoolX: Locked for new tokens.
APR up to 10%. Always on, always get airdrop.
Lock now!
You may also like

Research Report | In-depth Analysis of PumpBTC & PUMP Market Valuation
远山洞见•2025/04/02 10:03
Pump Fun Introduces PumpFi for Memecoins and NFTs Funding
Bitcoininfonews•2025/04/02 10:00

Bitcoin Price Weakness: Exploring Factors Beyond the US Tariff War and Market Sentiment
Coinotag•2025/04/02 09:22

Trending news
MoreCrypto prices
MoreBitcoin
BTC
$84,855.79
+0.78%
Ethereum
ETH
$1,871.52
-0.18%
Tether USDt
USDT
$0.9998
-0.01%
XRP
XRP
$2.11
-1.79%
BNB
BNB
$600.81
-1.56%
Solana
SOL
$125.79
-1.70%
USDC
USDC
$1.0000
-0.01%
Dogecoin
DOGE
$0.1719
+0.23%
Cardano
ADA
$0.6794
+0.38%
TRON
TRX
$0.2385
+2.03%
How to sell PI
Bitget lists PI – Buy or sell PI quickly on Bitget!
Trade now
Become a trader now?A welcome pack worth 6200 USDT for new Bitgetters!
Sign up now