In-depth analysis: The revenue sustainability of Ethereum, Solana and Tron

This report deeply analyzes the revenue structure of Ethereum, Solana, and TRON, and explores their long-term development potential and revenue sustainability.
Original title: "In-depth Analysis: Revenue Sustainability of Ethereum, Solana and Tron"
Original source: Frontier Lab
Introduction
With the rapid development of blockchain technology, the revenue sustainability of public chains has become a key indicator for evaluating their long-term development potential. This report focuses on the three major public chains in the current market - Ethereum, Solana and Tron. By analyzing their gas fee revenue composition, on-chain economic activities, and the sustainability of user revenue and expenditure, it deeply explores the revenue model and sustainability of these public chains.
According to the latest data provided by Defilama, in the past 30 days, Ethereum is far ahead with a total of US$99.89 million in gas fees, followed by Solana and Tron with US$46.21 million and US$38.97 million in gas fees, respectively. However, this revenue advantage is not fully reflected in market popularity and user activity. It is worth noting that Solana has been discussed more than Ethereum in the past six months, while TRON has gained wide recognition in the payment field with its low transaction fees.
More strikingly, the daily active address data shows a completely different pattern from the gas fee income: TRON tops the list with 2.1 million daily active addresses, followed by Solana with 1.1 million, and Ethereum with only 316,000. This phenomenon highlights the complex relationship between the composition of gas fee income, on-chain economic activities, and the sustainability of user income and expenditure, and also provides us with a unique perspective for in-depth analysis of the income sustainability of these three public chains.
This report will deeply analyze the income composition of Ethereum, Solana and TRON, and explore their long-term development potential and income sustainability.
Ethereum
Gas Fee Income Composition
Ethereum has undergone a series of major upgrades, including the transition from Proof of Work (PoW) to Proof of Stake (PoS) and the implementation of the EIP-1559 proposal, which has had a profound impact on its Gas fee structure. The new Gas fee structure is divided into two parts: the base fee (Base Fee) that is automatically destroyed by the system and the tips (Tips) paid directly to the validators. The destruction mechanism of the base fee is expected to push ETH into a deflationary state, potentially increasing its value. At the same time, the dynamically adjusted base fee helps to optimize the allocation of network resources, while the tips provide additional incentives for validators to maintain network security. This dual structure not only diversifies the income sources of validators and reduces the dependence on new coin issuance, but also creates long-term deflationary potential for ETH through the base fee destruction mechanism. Overall, this series of changes aims to enhance the economic sustainability and long-term value proposition of the Ethereum network.
In the past 30 days, Ethereum has destroyed about $47 million worth of ETH through the Base Fee mechanism. This data not only reflects the activity of the network, but also provides an important basis for analyzing the contribution ratio of various on-chain activities to total Gas consumption, which helps to gain a deeper understanding of the economic influence of different applications and transaction types in the Ethereum ecosystem. The main contributing entities of the destruction volume are shown in the figure below.
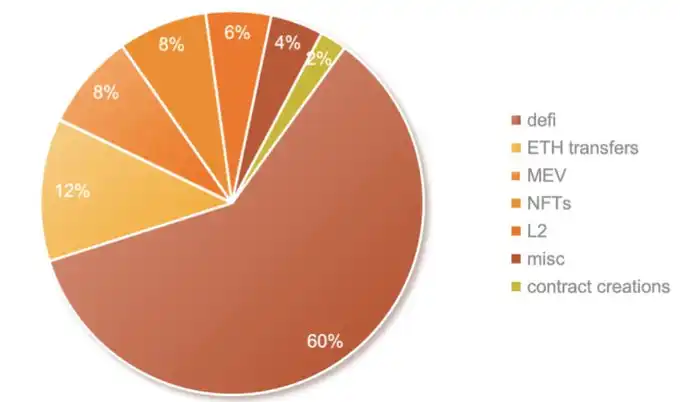
Figure 1-1 Statistics of Ethereum Ecosystem Destruction Volume
The distribution of Ethereum network Gas fee consumption reflects the activity of its ecosystem and the flow of economic value. According to the Gas fee burning ratio shown in the chart, we can clearly identify the dominant application categories on the Ethereum main chain and their relative importance. Decentralized Finance (DeFi) leads by a wide margin with a share of 60%, highlighting its core position in the Ethereum ecosystem. Closely following are ETH transfers (12%), MEV (maximum extractable value, 8%) and NFT (non-fungible tokens, 8%). These four categories together contribute 88% of the total Gas consumption and constitute the main economic activities of the Ethereum network. Layer 2 solutions (6%) and smart contract creation (2%) account for a relatively small proportion, which indirectly reflects that the development of the Ethereum ecosystem is temporarily in a "trough period".
Although the Ethereum network is currently in a relatively low period, its Gas fee consumption distribution still presents a diversified ecological pattern, dominated by DeFi, supplemented by ETH transfers, MEV and NFT and other fields, showing the network's continued vitality and a wide range of application scenarios, laying a solid foundation for the growth of the Ethereum network value.
On-chain economic activities
Defi
As a core component of the Ethereum ecosystem, decentralized finance (DeFi) covers a variety of sub-tracks, including decentralized exchanges (DEX), lending platforms, DEX trading robots, stablecoins, derivatives, crypto wallets, and liquidity pledge derivatives (LSD).
Through an in-depth analysis of Ethereum Gas burning details, we observed that tracks such as DEX, stablecoins, DEX trading robots, and crypto wallets performed outstandingly in terms of Gas consumption and ranked at the top, which reflects the dominant position and user activity of these sub-sectors in the current DeFi ecosystem.
Uniswap (DEX)
As the largest decentralized exchange (DEX) in the Ethereum ecosystem, Uniswap not only provides users with efficient on-chain spot trading services, but also serves as the infrastructure of the decentralized finance (DeFi) ecosystem, meeting the rigid needs on the blockchain network.
Uniswap's revenue in the past 30 days was US$54.23 million, of which the gas fee contributed was US$8.15 million, accounting for about 17.3% of the Ethereum ecosystem. Statistics (Figure 1-2) show that the top trading pairs on Uniswap are mainly composed of ETH and stablecoins, and the speculative Meme token transactions account for a very low proportion of the overall transaction composition. This phenomenon highlights the healthy ecology dominated by normal trading behaviors on the platform.
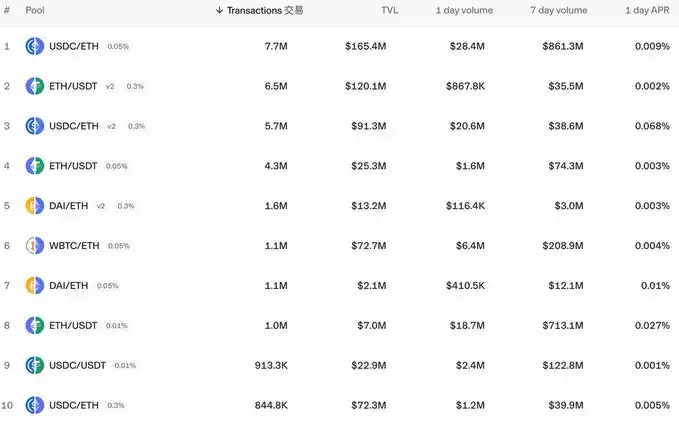
Figure 1-2 Top trading pairs in Uniswap (data source: https://app.uniswap.org/explore/pools)
1inch (DEX)
As the leading decentralized exchange (DEX) aggregator in the Ethereum ecosystem, 1inch integrates the liquidity pools of multiple DEXs to provide users with the best trading paths and prices, especially showing unique advantages in niche token transactions.
1inch contributed approximately $1.21 million in gas fees to the Ethereum ecosystem, accounting for 3% of the total.
The entire DEX track accounts for more than 40% of the DeFi field and more than 25% of the Ethereum ecosystem, highlighting the status of DEX as the most active track in Ethereum. Mainstream DEX projects are mainly based on normal transactions, and rarely involve Meme tokens, reflecting a healthy ecological composition. Although the DEX track accounts for the highest proportion, it only accounts for 25% of the Ethereum ecosystem, reflecting a reasonable distribution of gas fees.
Stablecoin transfers
As a key indicator of chain prosperity, stablecoin transfers rank second in the Ethereum ecosystem after DEX. They play a role similar to legal currency in on-chain transactions. They not only provide pricing benchmarks for other tokens, but also become the preferred intermediary for on-chain token transactions due to their trading convenience and low slippage advantages. They are mainly composed of USDT and USDC, two mainstream stablecoins in the industry, which effectively reflects the funding needs and activity of the Ethereum ecosystem.
In the past month, the gas fees burned related to stablecoin transfers on the Ethereum chain reached 4.01 million US dollars, accounting for about 8.5% of the total gas fees destroyed in the same period. This data not only reflects the strong demand for funds on the chain, but also highlights the importance of stablecoin transfers in measuring the sustainable development potential of public chains, because it is directly related to whether the public chain has sufficient funds and user base. Ethereum's strong performance in this indicator further confirms its leading position in the cryptocurrency ecosystem and its continued development momentum.
Dex Trading Bot
The rise of the Dex Trading Bot track stems from the popularity of Meme coin. As an automated trading tool designed for DEX traders, it is mainly used to facilitate users to buy Meme coins. With the surge in Meme coin projects, its market has shown extremely high volatility and short cycles (some are even active for less than 10 minutes), making transactions much more difficult. Often a few seconds of buying opportunity difference can determine profit and loss. Therefore, a large number of trading users use Dex Trading Bot to grab the opening of Meme coins. This process not only generates a large amount of Gas fees, but also includes a fairly high proportion of bribe fees. The purpose is to get blockchain miners to package their own transactions first, so as to gain an advantage in Meme coin transactions.
Figure 1-3 shows that Dex Trading Bot projects (mainly Banana Gun and Maestro) rank third in terms of gas fee contribution, second only to Uniswap and Ethereum/stablecoin transfers.
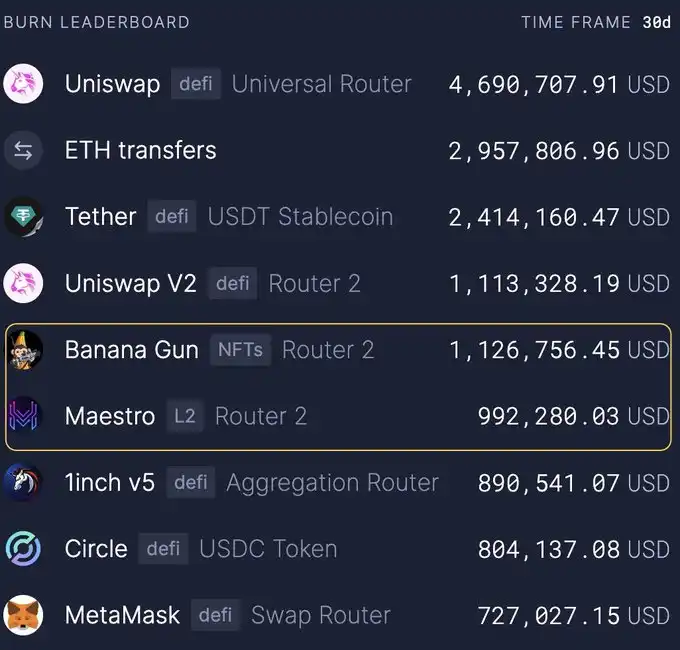
Figure 1-3 30-day Ethereum Base Fees Destruction Contribution Ranking
Banana Gun, as a cross-chain compatible Dex Trading Bot project, is mainly active on the Ethereum chain. In the past 30 days, it contributed up to 1.73 million US dollars in gas fees, not only ranking first among all Dex Trading Bot projects, but also accounting for 3.68% of the entire Ethereum ecosystem, demonstrating its dominant position in the field of automated trading tools.
Maestro is also a multi-chain compatible Dex Trading Bot project, with Ethereum as its main application scenario. In the past 30 days, it has generated $1.51 million in gas fees, ranking second among Dex Trading Bot projects, accounting for 3.21% of the total gas fees in the Ethereum ecosystem, highlighting its important influence in the automated trading market.
The prominent position of the Dex Trading Bot track in the Ethereum ecosystem (Gas fee contribution ranks third, accounting for about 6.9%) reflects its importance, and the current situation of obvious head effect (Banana Gun and Maestro occupy more than 90% of the market share) not only shows the concentration of this track, but also indirectly reflects the reasonable popularity of Meme coin transactions on the Ethereum chain. This balance not only meets the transaction needs, but also avoids the negative impact of excessive speculation on normal ecological projects on the chain, thus providing strong support for the healthy development of the Ethereum ecosystem.
Cryptocurrency Wallet
As the infrastructure of public chain user activities, the Gas fee contribution of the wallet not only reflects the real user activity on the chain, but also is a key indicator to measure the health of the public chain ecosystem. Data (Figure 1-4) shows that as the most widely used on-chain wallet project, MetaMask is the leader in the Ethereum ecosystem, contributing US$2.91 million in gas fees (burning US$940,000) in the past 30 days, accounting for about 2% of the entire Ethereum chain gas fees, highlighting the important position of the wallet track in the public chain ecosystem.
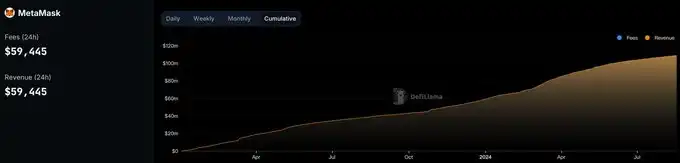
Figure 1-4 MetaMask contribution to gas fees (data source: https://defillama.com/fees/metamask)
On-chain transfers
As the second-ranked on-chain behavior, Ethereum on-chain transfers have burned $3.83 million in gas fees in the past month, with an estimated total contribution of approximately $25.5 million in gas fees, accounting for about 12% of the total gas fees in the Ethereum ecosystem, highlighting its important position in the ETH ecosystem and the strength of user demand.
MEV
MEV is a unique phenomenon in the transaction processing stage of the blockchain. On the Ethereum chain, it is reflected as an additional fee paid by users to speed up transactions. The base fee is destroyed, and the miner's tip belongs directly to the miner. This mechanism is more clear after the EIP-1559 upgrade. Excessive MEV demand often reflects the unhealthy development of the on-chain ecology. Especially in the Meme coin project, due to time sensitivity, users continue to increase MEV fees to gain an advantage. Therefore, the amount of MEV fees can also indirectly reflect the activity of the Meme coin project on the chain to some extent. The burning fee of MEV on the Ethereum chain is about 3.76 million US dollars, accounting for 8% of the total burning fee on the chain. This data shows that the behavior of participating in the Meme coin project is not dominant in the Ethereum ecosystem.
Ethereum Ecosystem Summary
The Ethereum ecosystem shows a diversified but concentrated development trend in several major areas. The DeFi track is far ahead with a 60% share of gas fees, highlighting its core position, but the internal sub-tracks are reasonably distributed. ETH transfers (12%), MEV (8%) and NFT (8%) follow closely behind, and these four categories account for 88% of the total gas consumption. The sub-tracks with the most on-chain gas fees are DEX (26%), on-chain transfers and stablecoins (17%), Dex Trading Bot (7%) and wallet tracks (3%), accounting for a total of 53%. Layer 2 solutions (6%) and smart contract creation (2%) account for a small proportion, reflecting that the development of the ecosystem may be in a "trough period". Despite this, this decentralized gas fee distribution still reflects the relatively balanced development of Ethereum's various tracks, without the phenomenon of excessive concentration in a single track, showing the overall health of the ecosystem.
Solana
Transaction Fee Composition
The fees and costs on the Solana chain can be divided into three parts:
· Transaction Fees - Fees for validators to process transactions/instructions
· Priority Fees - Optional Fees to Increase the Order of Transaction Processing
· Rent - Reserved Balance for Keeping Data Stored on-Chain
The Solana chain stipulates that a fixed percentage of each transaction fee (initially 50%) is destroyed, and the remaining 50% belongs to the validator. Solana stakers have received transaction fee rewards worth $23.1 million in the past 30 days.
The popularity of the Meme coin project on the Solana chain has led to extremely high transaction time sensitivity, prompting users to significantly increase priority fees to gain an advantage, thereby significantly increasing Solana stakers' handling fees and bribes.
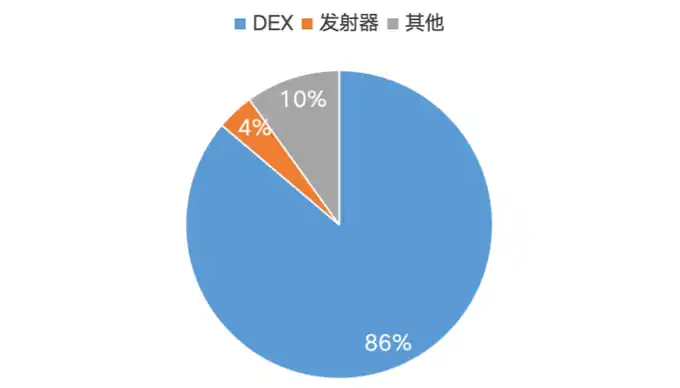
Figure 2-1 The proportion of interactions in each track within 30 on the Solana chain
The amount of interaction on the Solana chain directly reflects the frequency of transactions on the chain, which is closely related to Solana's handling fee income. From the data in Figure 2-1, we can clearly see that the distribution of activities on the Solana chain is as follows:
· DEX (decentralized exchange) activities dominate, with a share of up to 86%
· Transmitters (which may refer to token issuance or other specific functions) account for 4%
· Other activities account for 10%
DEX activities play a core role in the Solana ecosystem.
On-chain economic activities
DEX
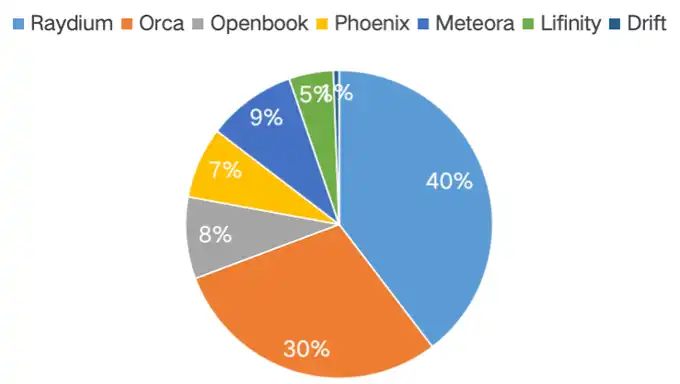
Figure 2-2 Solana on-chain DEX interaction volume share
Figure 2-2 shows that Raydium and Orca account for 70%, becoming the main place for Solana on-chain activities.
As the largest decentralized exchange in the Solana ecosystem, Raydium generated $52.37 million in transaction fees in the past 30 days. The data statistics in Figure 2-3 show that its revenue mainly comes from Meme coin trading pairs, highlighting the dominant position of speculative Meme coin transactions in the current Solana DeFi market and its significant contribution to the platform's revenue.
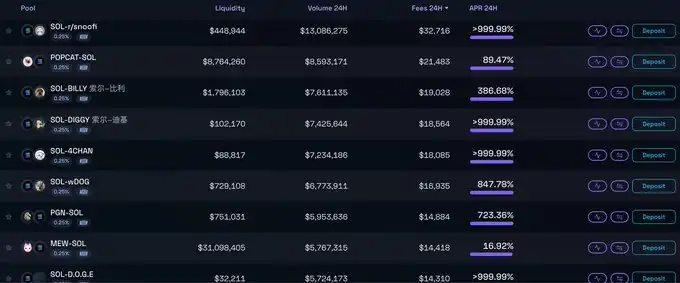
Figure 2-3 Raydium revenue ranking top trading pairs (data source: https://raydium.io/liquidity-pools/?tab=all&sort_by=fee)
As the second largest decentralized exchange in the Solana ecosystem, Orca has generated $12.25 million in transaction fees in the past 30 days, of which more than 50% of the revenue comes from Meme coin trading pairs, reflecting the continued influence of speculative Meme coin transactions in the Solana DeFi market and its important contribution to platform revenue.
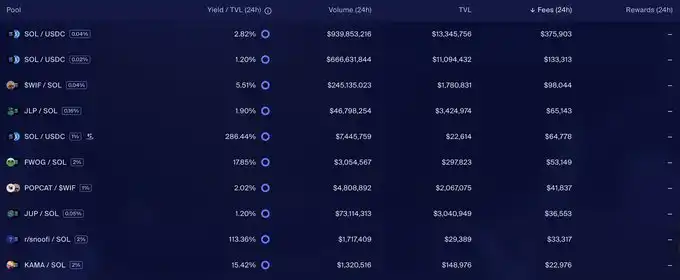
Figure 2-4 Orca revenue ranking top trading pairs (data source: https://www.orca.so/pools)
Recent data from the Solana ecosystem shows that the DEX track accounts for 86% of on-chain interactions and an estimated 80% of transaction fees, with Raydium and Orca accounting for 70% of the DEX market. It is worth noting that Meme coin transactions account for more than 90% and 60% of these two DEXs, respectively, and it is estimated that Meme coin transactions contribute more than 55% of the gas fees in the entire Solana ecosystem. Specifically, of Solana's $46.21 million in gas fee revenue in the past 30 days, Meme coin transactions contributed about $30 million. Although Meme coin transactions have increased on-chain activity and revenue in the short term, their essence is speculative behavior that continuously extracts funds from participants. Therefore, despite the impressive data performance, we believe that this development model driven mainly by Meme coins lacks sustainability, and the Solana ecosystem urgently needs to seek a more balanced and healthy growth path.
MEV
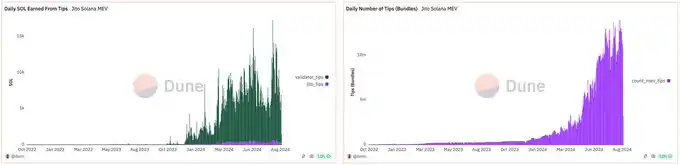
Figure 2-5 Solana chain MEV daily fee (data source: https://dune.com/ilemi/jitosol)
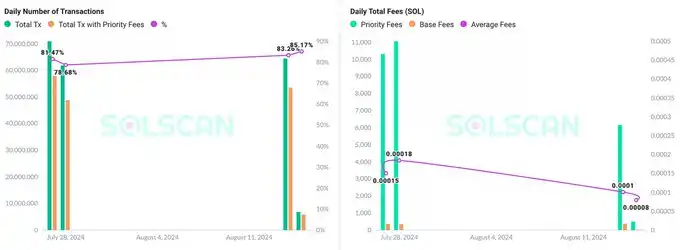
Figure 2-6 Solana chain MEV share (data source: https://beta-analysis.solscan.io/public/dashboard/06d689e1-dcd7-4175-a16a-efc074ad5ce2)
The MEV (maximum extractable value) mechanism on the Solana chain has shown a new development trend due to the surge in demand for Meme coin transactions, and has become one of the main features of on-chain transactions.
In the past 30 days, the transaction volume with priority fees (MEV) on the Solana chain accounted for 82.45% of the total transaction volume, indicating that the vast majority of transactions used the MEV mechanism. MEV fees account for as much as 80% of the handling fees, highlighting its importance in the Solana ecosystem. Specific data shows that Solana's handling fee income in the past 30 days was US$46.21 million, of which MEV fees exceeded US$30 million. These data further confirm the dominant position of Meme coin transactions in Solana's current ecosystem, and also reflect the phenomenon that users use the MEV mechanism in large quantities to seize the opportunity of Meme coin transactions.
Dex Trading Bot
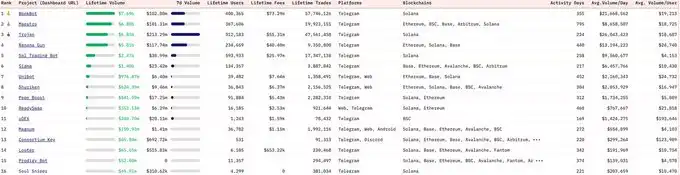
Figure 2-7 Dex Trading Bot ranking (data source: https://dune.com/whale_hunter/dex-trading-bot-wars)
Through the analysis of the Dex Trading Bot trading volume ranking, it is found that the top three Dex Trading Bot projects (Photon, Bonkbot and Trojan) account for more than 90% of the transaction share of this chain.
· Photon’s revenue in the past 30 days is 18.96 million US dollars
· Bonkbot’s revenue in the past 30 days is 3.35 million US dollars.
· Trojan’s revenue in the past 30 days is 11.36 million US dollars.
Based on the above data, the Dex Trading Bot project earned approximately $33.67 million in 30 days on the Solana chain.
Solana Ecosystem Summary
About 80% of Solana on-chain transactions are contributed by Meme coin transactions. The monthly cost expenditure of Meme coin players is:
· MEV priority fee: $30 million
· Dex Trading Bot usage fee: $30 million
· DEX transaction fee: $50 million
· Estimated monthly loss of Meme coin players: $110 million
Based on the above data analysis, Solana's current ecological prosperity model driven by Meme coins has significant sustainability risks. Although Meme coin transactions have brought Solana considerable on-chain activity and revenue in the short term, this model has imposed a huge financial burden on participants. Fixed player losses of over $100 million per month, annualized to $1.3 billion, highlight the unsustainability of the current model.
The Meme coin project inherently lacks long-term value support, and its prosperity depends largely on continued capital inflows and user participation. However, as participant losses continue to accumulate, market heat may be difficult to maintain. The Solana ecosystem faces severe challenges and needs to seek a more balanced and sustainable development path, reduce dependence on a single, high-risk track, and cultivate applications and projects that can create long-term value to ensure the healthy development and long-term prosperity of the ecosystem.
Solana ecosystem participants and decision makers carefully evaluate the current development model and formulate strategies to reduce dependence on Meme coin transactions, while actively exploring and supporting projects with substantial value and long-term development potential to build a more robust and sustainable blockchain ecosystem.
Tron
The Tron chain is uniquely designed, and the on-chain fees are mainly used to compensate for network energy and bandwidth consumption, rather than node bribes, including:
· Computational Energy Fee:Computational resources used to process and verify transactions.
· Bandwidth Fee:Used to propagate transaction data in the blockchain network.
Users need to burn TRX to pay for transaction resources when bandwidth or energy is insufficient, promoting TRX deflation.
Figure 3-1 shows that since October 29, 2021, the circulation of TRX has shown a continuous deflationary trend. This phenomenon is mainly attributed to the widespread use of USDT on the Tron network and the significant growth in its trading volume. The continued expansion of stablecoin transfer activities provides strong support for TRX's deflationary mechanism and guarantees the sustainability of TRX's economic model.
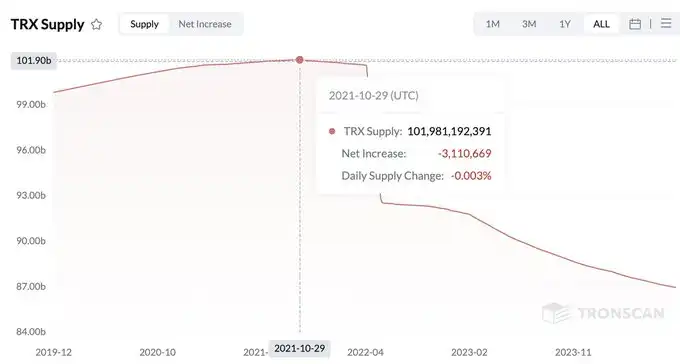
Figure 3-1 Statistics of the total circulation of TRX (data source: https://tronscan.org)
Figure 3-2 shows that, taking the data on July 22, 2024 as an example, USDT transfers account for 94.51% of Tron's on-chain activities, highlighting its absolute dominance in the Tron ecosystem. The design advantages of the Tron chain, including a fixed low transfer fee of 1U (not affected by the amount), a fast block time of 3 seconds (compared to Ethereum's 16 seconds), and no need to pay additional priority fees, give it a significant competitive advantage in the field of on-chain payments. These features not only meet the market's demand for efficient and low-cost payment solutions, but also verify Tron's initial positioning as a public payment chain. These advantageous features of Tron have effectively attracted a large number of users, especially in the stablecoin transfer scenario, thereby driving the continued growth of on-chain activities and consolidating its key position in the digital payment infrastructure.
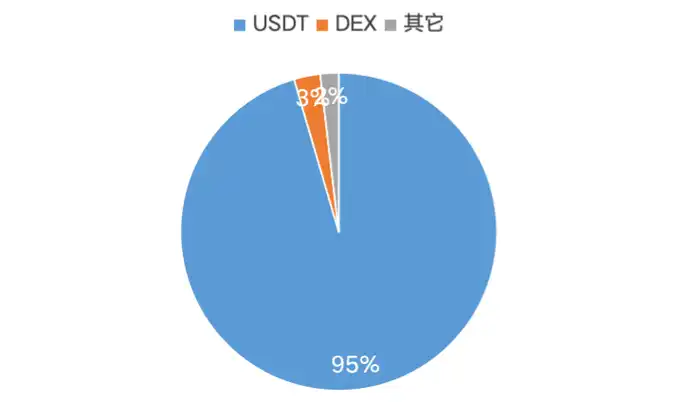
Figure 3-2 Detailed breakdown of energy consumption by project on Tron chain on July 22, 2024 (data source: https://tronscan.org/#/data/charts/contracts/top-contracts)
The number of daily transactions on the Tron network has shown a strong growth trend, especially since 2024. This may reflect the expansion of the Tron ecosystem and the increase in user adoption. During July and August 2024, the transaction volume reached a new high, breaking through 8 million transactions several times, and the highest point was close to 9 million transactions. This is due to the fact that the hype of Meme tokens began to extend to the Tron public chain.
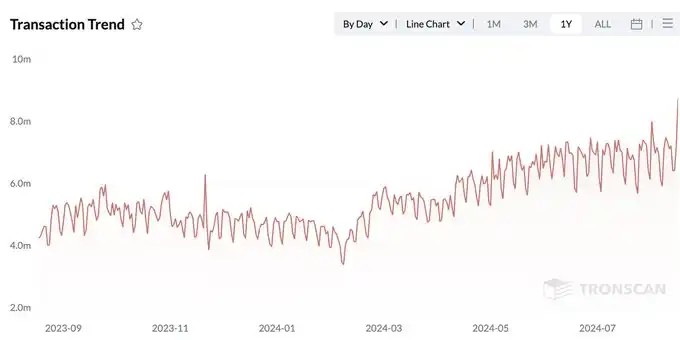
Figure 3-2 TRX transfer trend statistics (data source: https://tronscan.org)
In August 2024, Tron founder Justin Sun strategically announced his entry into the Meme track, which quickly attracted a large number of Meme projects to settle in the Tron ecosystem. Data shows that as of August 20, the energy consumption structure on the Tron chain has changed significantly: although USDT transfers still rank first, the proportion has dropped to 52%, while the proportion of decentralized exchange (DEX) activities has surged from 3% to 47%. This data change strongly confirms that the large-scale entry of Meme projects has brought a significant increase in on-chain activities to Tron in the short term, reflecting that Justin Sun’s strategic deployment has begun to bear fruit, and it also indicates that the Tron ecosystem may be undergoing a structural change.

Figure 3-3 Detailed breakdown of energy consumption by projects on the Tron chain on August 20, 2024 (data source: https://tronscan.org/#/data/charts/contracts/top-contracts)
Although the proportion of USDT transfers in the overall ecosystem has dropped significantly, its actual energy consumption has remained stable, maintaining in the 80B-90B range. This phenomenon shows that although the introduction of the Meme project has greatly increased on-chain activities, it has not substantially affected the core business of the Tron ecosystem - USDT transfers. This not only highlights the importance of USDT transfers as a rigid demand of users, but also confirms its status as the cornerstone of the Tron ecosystem. This observation further suggests that even if the Meme coin craze may recede in the future, the basic operations and stability of the Tron ecosystem are not expected to be significantly impacted. This structural resilience provides strong support for Tron's long-term development.
Although Tron's on-chain fee income is highly concentrated in USDT transfers, this concentration reflects the rigid demand of users for stablecoin transfers. In addition, the huge stablecoin transfer income not only highlights the high dependence of users on the Tron network, but also confirms the health and sustainability of the gas fee income structure of the Tron ecosystem.
Summary
This report deeply analyzes the income structure and sustainability of the three major public chains Ethereum, Solana and Tron, and draws the following key conclusions:
Ethereum: Demonstrates the most balanced and sustainable development model
· Diversified income sources:DeFi (60%), ETH transfers (12%), MEV (8%) and NFT (8%) and other fields have balanced development.
· Ecosystem Health:Core applications such as DEX and stablecoin transfers account for a reasonable proportion, reflecting real and continuous user demand.
· Innovation and Upgrades:Upgrades such as EIP-1559 optimize the fee mechanism and create long-term value through ETH destruction.
· Long-term Potential:Diversified application scenarios and continuous technological innovation provide strong long-term development momentum for Ethereum.
Solana: Rapid Growth but Sustainability Challenges
· Highly Concentrated Revenue:DEX activities account for 86%, of which Meme coin transactions contribute more than 55% of gas fees.
· MEV Usage:82.45% of transactions use MEV, reflecting a highly speculative environment.
· High user costs:Meme coin players lose an estimated $110 million per month, or $1.3 billion per year.
· Sustainability risks:A model that relies too much on Meme coin transactions is difficult to maintain in the long term and requires strategic adjustments.
Tron: Focusing on the payment field, showing unique advantages
· Stablecoin dominance:USDT transfers account for 94.51% of on-chain activities, reflecting its strong position in the payment field.
· Obvious technical advantages:Low fees, fast confirmation and fixed fee models are suitable for large-scale payment applications.
· Structural resilience:Even in the meme coin boom, the core USDT transfer business remains stable.
· Long-term sustainability:Stablecoin transfers based on rigid demand provide Tron with a reliable long-term source of income.
Comprehensive evaluation
Ethereum shows the strongest long-term sustainability with its diversified ecosystem and continuous technological innovation.
Although Solana is growing rapidly, its model of over-reliance on Meme coin transactions poses significant risks and requires strategic transformation to ensure long-term development.
Tron has established a unique market position and sustainable revenue model by focusing on the payment field, especially stablecoin transfers.
Disclaimer: The content of this article solely reflects the author's opinion and does not represent the platform in any capacity. This article is not intended to serve as a reference for making investment decisions.
You may also like
Bitcoin Soars to $97K: Dogecoin, Sonic, Litecoin, and AERO Spearhead Altcoin Surge
Bitcoin's Surge to $97K Triggers Altcoin Upswing: Dogecoin, Sonic, Litecoin & AERO Take the Lead Fueled by ETF Inflows and Net Outflows

IRS Crypto Chiefs Leave After Accepting DOGE Resignation Plan

Pi Network Empowers Users with Wallet Activation Leap
In Brief Pi Network enables wallet activation for partially KYC-verified users. The Pi Core team redefined wallet opening while maintaining security standards. Third-party services increase accessibility and global reach for Pi Network.

Hyperliquid (HYPE) To Rise Further? Key Harmonic Pattern Signaling an Upside Move